Using quick analysis
TrueSight Capacity Optimization quick analysis enables you to include on a single chart:
- Multiple metrics of the same object
- Metrics of different objects, even if they are different types (such as z/OS images and Suites)
Note
For more information, see
Quick analyses
 in the TrueSight Capacity Optimization documentation.
- From the TrueSight Capacity Optimization console, navigate to Workspace.
- Open several levels of hierarchy in the domain to which you loaded your data, and click an object in which you are interested.
If the object has configuration metrics, they are displayed in the Summary tab.
- Click the Metric tab and navigate to the metric in which you are interested.
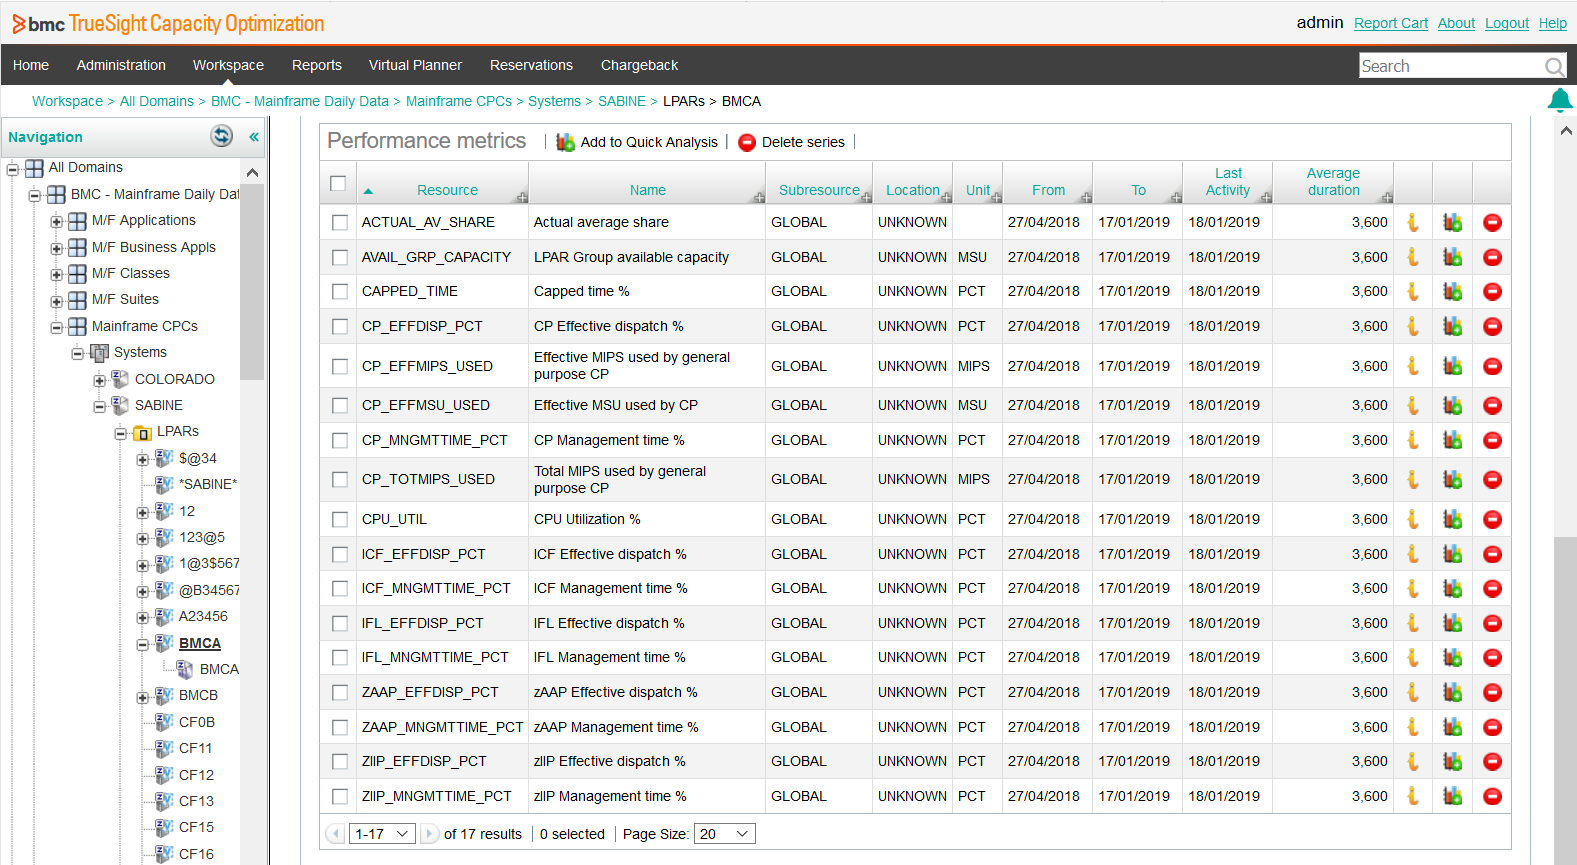
If you see a number of subresources in the Subresource column, you must click the link to select a subresource.
If you see a colored bar chart icon to the right of the metric, you can click it to display a chart:
- To proceed, you can:
- Use the Add series or Edit buttons
- Return to the Navigation pane and choose another object
Notes
- To maximize the working area, you can collapse the Navigation pane by clicking
<<. To expand the pane again, click >>. - The default time span and resolution settings might cause no data to be found. If that happens, update the Resolution field to Hourly and specify a time span for which data exists.
In a quick analysis, TrueSight Capacity Optimization does not prevent displaying different units on the same chart; distinguishing between them is your responsibility. For example, the following chart displays two metrics, CPU Utilization % and MSU MIPS Used by CP. The chart legend lists the units for each selected metric.

Was this page helpful? Yes No
Submitting...
Thank you
Comments
Log in or register to comment.