DWP Request Overview dashboard
The DWP Request Overview dashboard displays service request reports. As a dashboard user, you can view reports for service requests based on status, age, submission trend, fulfillment trend, and popularity. Learn about instructions on creating or editing dashboards in Configuring dashboards, panels, and queries. Learn more about dashboard concepts in Setting up dashboards.
The following image shows the DWP Request Overview dashboard with sample data:

For a list of icons and operations that are common across dashboards, see Orientation.
BMC Helix Digital Workplace dashboard filters
You can search reports in DWP Request Overview dashboard by using the following filters:
- Company—Filter by the name of the company. For example, Petramco.
- Organization—Filter by the name of the organization. For example, Human Resources.
- Department—Filter by the name of the department. For example, Personnel.
- Region—Filter by the name of the region. For example, Americas.
The filters are based on Foundation data in BMC Helix Innovation Suite. To learn more about Foundation data, see
Foundation data model
 .
.
To view the BMC Helix Digital Workplace dashboard
- On the left navigation pane, hover over the Dashboards
 icon and click Browse.
 In the Helix Digital Workplace folder, click DWP Request Overview Dashboard.

Tip: Quick access from the home page
To quickly open the dashboard from the home page, mark it as a favorite by using the star icon. Additionally, after you open a dashboard, it is automatically available under Recently viewed dashboards on the home page.
BMC Helix Digital Workplace dashboard panels
The following table describes the DWP Request Overview dashboard panels that are provided out of the box:
| Panel | Description | Example |
|---|---|---|
| Number of Requests Raised | Displays the total number of service requests submitted during the selected period. |
|
| Active Service Requests | Displays the total number of service requests that are not fulfilled during the selected period. This panel includes service requests with the following statuses:
|
|
| Fulfilled Service Requests | Displays the total number of closed or completed service requests during the selected period. |
|
| Service Requests Waiting Approval | Displays the total number of service requests that are in the Waiting for Approval status during the selected period. The color of the number of service requests displayed depends of the following thresholds:
Tip: To change the thresholds, copy the dashboard and
modify the threshold configuration
|
|
| Failed Service Requests | Displays the total number of unfulfilled service requests during the selected period. The color of the number of service requests displayed depends of the following thresholds:
Tip: To change the thresholds, copy the dashboard and
modify the threshold configuration
|
|
| Average Age | Displays the average time taken to fullfill a service request during the selected period. The color of the average age displayed depends of the following thresholds:
Tip: To change the thresholds, copy the dashboard and
modify the threshold configuration
|
|
| Daily Submission Trend | Displays the number of service requests created daily during the selected period. |
|
| Daily Fulfillment Trend | Displays the number of service requests fulfilled during the selected period. |
|
| Open Requests by Age Buckets | Displays the number of open service requests during the selected period by the following number of days open:
Tip Compare the information in this panel with the end-user feedback to determine how satisfied customers are with the service request fulfillment. You can click the bar charts to view the service request details. The service request details are displayed in the Service Request Details - Drill-through dashboard. Important You must upgrade Converged Platform to version 21.3.01 in order to view the Service Request Details - Drill-through dashboard. |
|
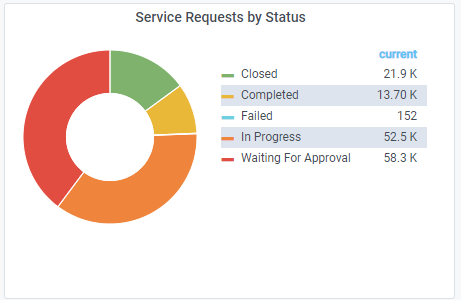
| Service Requests by Status | Displays the number of service requests during the selected period by the following statuses:
|
|
| Top 10 Requested Categories | Displays the top 10 categories of requested services during the selected period. Important: This panel shows only the top-level categories. For more information, see
Creating separate top-level categories for HR and IT requests
You can click the bar charts to view the service request details. The service request details are displayed in the Service Request Details - Drill-through dashboard. Important You must upgrade Converged Platform to version 21.3.01 in order to view the Service Request Details - Drill-through dashboard. |
|
| Top 10 Requested Services | Displays the top 10 requested services during the selected period. You can click the bar charts to view the service request details. The service request details are displayed in the Service Request Details - Drill-through dashboard. Important You must upgrade Converged Platform to version 21.3.01 in order to view the Service Request Details - Drill-through dashboard. |
|
| Top 10 Sites | Displays the top 10 sites from where service requests were created during the selected period. You can click the bar charts to view the service request details. The service request details are displayed in the Service Request Details - Drill-through dashboard. Important You must upgrade Converged Platform to version 21.3.01 in order to view the Service Request Details - Drill-through dashboard. You can click the bar charts to view the service request details. The service request details are displayed in the Service Request Details - Drill-through dashboard. Important You must upgrade Converged Platform to version 21.3.01 in order to view the Service Request Details - Drill-through dashboard. |
|


To create custom panels in the dashboard
You cannot modify the out-of-the-box dashboard.
To change the out-of-the-box reports, create a copy of the dashboard, and modify the panels. As an administrator or an editor, you can create custom panels in the dashboard by using the Service Management query type. To learn how to fetch data by using this query type, see Service Management query.
Comments
Log in or register to comment.