BMC Helix ITSM Insights dashboard
As a Service Desk Manager or a Problem Coordinator, you can track and analyze the Proactive Problem Management and Incident Correlation metrics in the ITSM Insights dashboard. Using these metrics, you can track the usage of ITSM Insights and the business value it provides.
The ITSM Insights dashboard is available only with ITSM Insights 21.3 and later versions.
For instructions about creating or editing dashboards, see Configuring dashboards, panels, and queries. For information about dashboard concepts, see Setting up dashboards.

Example: Tracking Proactive Problem Management and Incident Correlation metrics
Susan, the Service Desk Manager is using the ITSM Insights dashboard to understand the value provided by ITSM Insights. She is analyzing the incident statistics for a company for a defined period. She needs to identify the top emerging clusters and the users who have created the most number of incident relationships in ITSM Insights.
Colin, the Problem Manager, needs a high-level summary of problem management KPIs. To get a quantitative validation for the business value provided by ITSM Insights, he tracks the following KPIs:
- Number and percentage of problem investigations created from ITSM Insights
- Number of incidents being related to problems in ITSM Insights
- Status of various problems for a company
- Number of jobs and job executions from ITSM Insights
- Number of problem investigations that have been created for reopened incidents
The following image shows the ITSM Insights dashboard with sample data:

ITSM Insights dashboard filters
You can use the following filters to view KPIs on the ITSM Insights dashboard:
- Company—Filter by company as shown in the following image:

By default, All is selected in this filter. - Time range—Filter by the date range such as an hour, previous week, or previous month. By default, the selected time range is Last 7 days.

To view the dashboard
- In the left navigation pane, hover your mouse over Dashboards
 and click Browse.
 Click the Helix AI Service Management folder and then click ITSM Insights.
Tip
To quickly open the dashboard from the home page, mark it as a favorite by using the star icon. Additionally, after you open a dashboard, it is available under Recently viewed dashboards on the home page.
Panels in the ITSM Insights dashboard
The following table describes the ITSM Insights dashboard panels:
| Panels | Description | Example |
|---|---|---|
| Problem Management Jobs | Displays the total number of clustering jobs created in the Proactive problem management workspace. |
|
| Number of Job Executions | Displays the number of times the problem management jobs have been executed. |
|
| Change Requests Related to PBI | Displays the number of change requests that are associated with problem investigations created in the Proactive problem management workspace. |
|
Incidents Related to Problems | Displays the number of incidents that are related to problems created from the Proactive problem management workspace in ITSM Insights. |
|
Parent Relationships Created in ITSM Insights | Displays the number of parent relationships created in the Real-time incident correlation workspace. |
|
| PBI Created for Reopened Incidents | Displays the number of problem investigations created for reopened incidents. |
|
| Percentage of Problem Investigations Created in ITSM Insights | Displays the percentage of problem investigations created in the Proactive problem management workspace as compared to the total problem investigations created. The percentage of problem investigations is calculated as:
|
|
Problem Investigations Created in ITSM Insights | Displays problem investigations created in ITSM Insights by status. |
|
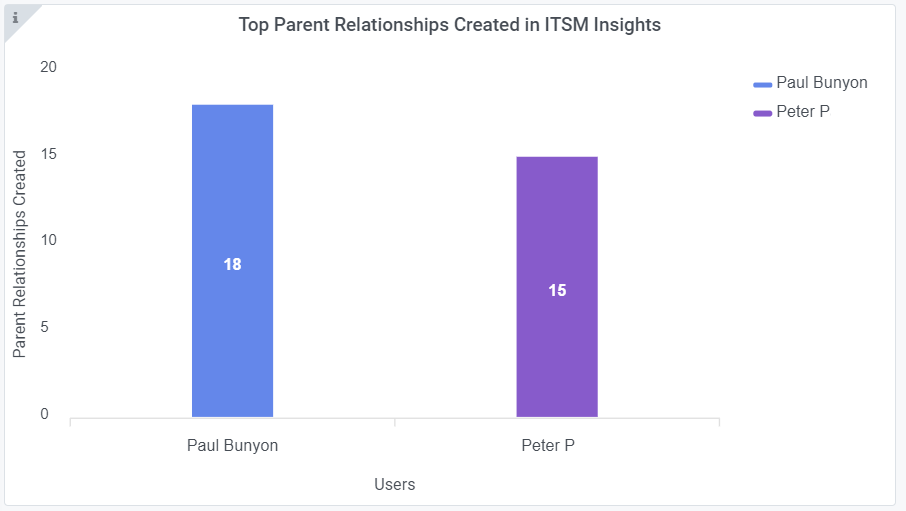
| Top Parent Relationships Created in ITSM Insights | Displays the users who have created the highest number of parent relationships in the Real-time incident correlation workspace. By default, the top five users are displayed. |
|
| Top Emerging Clusters | Displays the clusters with most incoming incidents in a chart. By default, the top five clusters are displayed. To change the number of clusters on the panel, perform the following steps:
|
|


Comments
Log in or register to comment.