Managing Infrastructure Management devices from the TrueSight console
Use the Managed Devices page to view, manage, and monitor the BMC TrueSight Infrastructure Management components. By default, they are displayed in a hierarchical order.
To view the Managed Devices page, in the navigation pane of the TrueSight console, expand Configuration and select Managed Devices.
Fields and options on the Managed Devices page
The following figure highlights the various fields and options that are available on the page.

# | Field/ Option | Description | ||||||||||||||||||
|---|---|---|---|---|---|---|---|---|---|---|---|---|---|---|---|---|---|---|---|---|
| Main action menu | Displays the following options:
| ||||||||||||||||||
| Quick filters | Displays connection status of the Integration Services and PATROL Agents as separate buttons. Each button displays the total count of the Integration Services or PATROL Agents that matches the connection status.
| |||||||||||||||||||
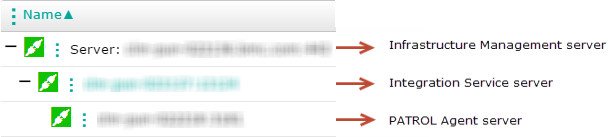
| Managed devices table | Displays the Infrastructure Management servers for which you have access to. For each server, the associated Integration Service and PATROL Agents are displayed. You can sort the the contents of the table by clicking a column name. Sorting works only on the PATROL Agent rows. For more information, see To sort the PATROL Agents. The table shows the following information:
| ||||||||||||||||||
| Common action menu | A context-sensitive menu that displays options based on the selection in the Managed devices table. Note: Certain menu options are displayed only when the selected server is in connected state.
| |||||||||||||||||||
| Infrastructure Management server action menu | Displays the following options:
| |||||||||||||||||||
Integration Service action menu | Displays the following options when the Integration Service is in connected state:
Displays the following options when the Integration Service is in disconnected state:
| |||||||||||||||||||
| PATROL Agent action menu | Displays the following options when the PATROL Agent is in connected state:
Displays the following options when the PATROL Agent is in disconnected state:
For more information about these options, see Performing actions on a PATROL Agent. | |||||||||||||||||||
| Managed devices search icon | Enables you to find a device or server by performing a textual search on the column values. The search is not case sensitive and is performed on all servers, irrespective of any filter that you might have applied. To search, click the search icon | |||||||||||||||||||
| Refresh page icon | Enables you to manually refresh the page. | ||||||||||||||||||
| Collapse or expand quick filter | Enables you to collapse or expand the filter area to give you more display area for the Managed devices table | |||||||||||||||||||
Add Integration Service button | A quick access button that enables you to add an Integration Service to an Infrastructure Management server. For more information, see Managing Integration Services. | |||||||||||||||||||
| Managed devices table view menu | Displays the following options:
| |||||||||||||||||||
| Deployment status icon | Displays the status of deployment. Click here to view all the deployment statuses in detail. Click the deployment status icon to view the latest deployment details in the PATROL Agent Details page. Note The following icons are not clickable:
|

To view details of an Integration Service
- Click + against the Infrastructure Management server.

The Integration Service is displayed. - To view details for an Integration Service, click the Integration Service action menu, and select View. Alternatively, click the Integration Service name. The View Integration Service Details page shows details that are specified when the Integration Service is configured or added to the Infrastructure Management Server.
- Click + against the Integration Service to view the associated PATROL Agents.
Note
Only PATROL Agents that have successfully established communication with the Presentation Server are displayed as connected to an Integration Service.
To connect, disconnect, and restart an Integration Service
The Servers page displays the connection status of the Integration Services.
- Click + to expand the Infrastructure Management Server with the Integration Service that you want to perform action on.
- Click the Integration Service action menu and select Connect or Disconnect or Restart, depending on the action that you want to perform. The icon next to the Integration Service changes color to depict the changed server status.
To identify the connection status of the Infrastructure Management, Integration Service, and PATROL Agent servers
Each Infrastructure Management, Integration Service, and PATROL Agent server has an icon displayed next to it that indicates the connection status.
| Icon | Connection Status |
|---|---|
| Connected | |
| Disconnected | |
| Connection status unavailable |
You can use the Quick filter to view only connected or disconnected Integration Services and connected or disconnected PATROL Agents.

To display specific PATROL Agents
You can filter out PATROL Agents and view only specific Agents. To do so, use any of the following options:
| Filtering Option | Details |
|---|---|
| Agent filter |
|
| Managed devices search | Find PATROL Agents by performing a search on their names. The search is not case sensitive and is performed on all servers, irrespective of any filter that you might have applied. To search, click the search icon |
| Quick filter | If you want to view only connected or disconnected PATROL Agents, or only those Agents that are associated with connected or disconnected Integration Services, or a combination of these conditions, click the corresponding buttons in Quick filter. |

At any point in time, you can view the total count of PATROL Agents that are currently displayed in the Managed devices table.
To sort the PATROL Agents
You can sort the PATROL Agents in the Managed devices table based on a single column or multiple columns of the table. In multiple-column sorting, the order or hierarchy of the sorting is based on the order in which you selected the columns. The first selected column is called primary column.
- Click the column name that you want to sort on.
- To select another column, press the CTRL key and click the other column name. Repeat this step in the order in which you want to sort the columns.
- To remove the applied sorting, release the CTRL key and click any column name.
To view status of the applied policies on a PATROL Agent
The icon in the Policy Status column of the Managed devices table indicates the status of the policies that are applied on the corresponding PATROL Agent. The icon tool tip provides more details.
| Icon | Description |
|---|---|
Indicates that the Agent is currently not managed by policies. | |
Indicates that policies were applied on the Agent. | |
Indicates that the configuration status of the agent is unknown. | |
Indicates that an error occurred and some policies could not be applied. |
Where to go from here
Comments
Log in or register to comment.