Google Cloud Platform - GCP API Extractor
Use the Google Cloud Platform - GCP API Extractor to collect configuration and performance data of your virtual machines that are provisioned in the Google Cloud Platform (GCP) cloud. The collected data is used for analyzing and optimizing the capacity of your Google Cloud infrastructure.
The ETL makes the API calls to collect the following metrics:
- GCP metrics from the Google Compute Engine and Google BigQuery services
- Stackdriver metrics from virtual machine instances
If your setup is behind a firewall, ensure that the ETL can access the following API endpoints:
- Billing: cloudbilling.googleapis.com
- Stackdriver logging: logging.googleapis.com
- Stackdriver monitoring: monitoring.googleapis.com
- Cloud Resource manager: cloudresourcemanager.googleapis.com
- Compute engine: compute.googleapis.com
- Storage bucket: storage-component.googleapis.com
- Authentication: oauth2.example.com, www.googleapis.com
Additionally, if you encounter issues with API requests due to 1e100.net domain, include it in the firewall allow rules.
If you apply tags to categorize the GCP resources by related business services, you can configure the ETL to display business services and their related resources as a hierarchy in the Workspace. This hierarchy enables you to sort and view capacity management metrics by business services.This ETL works in conjunction with the Google Cloud Platform - Billing and Usage Extractor. The entities and metrics that the GCP API ETL collects are mapped to the cost and usage data that is collected by the GCP Cost and Usage ETL.
Collecting data by using the GCP API ETL
To collect data by using the GCP API ETL, do the following tasks:
I. Complete the preconfiguration tasks.
II. Configure the ETL.
III. Run the ETL.
Before you configure and run the ETL, complete the following tasks:
| Step | Details |
|---|---|
Subscribe to the Google Cloud Platform. | |
Create projects to manage virtual machine instances, billing, and Cloud Platform services. |
|
Create a service account to authenticate applications that run on your virtual machine instances to access other Google Cloud Platform services. If you want to retrieve data for multiple projects by using a single ETL, create a separate Service account key file for each project. |
|
Add the email addresses of the service accounts for the projects (projects that are linked to the billing account) to the billing account, and assign the Billing Account Viewer role to each service account that you want to use for the ETL. |
|
Enable the Google Compute Engine APIs for data collection. | |
Create a Stackdriver account. | |
Install the Monitoring agent. Install the Stackdriver Monitoring agent on each of your virtual machines. This agent collects additional data from your virtual machines, which includes metrics and logs from third-party applications. Remember The Monitoring agent is available only with the Premium Tier subscription of Stackdriver. |
|
Ensure that the time is correctly set on the host where the ETL engine runs. | BMC recommends to use the Network Time Protocol (NTP) client and synchronize the host clock with the network time server. |


You must configure the ETL to connect to GCP for data collection. ETL configuration includes specifying the basic and optional advanced properties. While configuring the basic properties is sufficient, you can optionally configure the advanced properties for additional customization.
A. Configuring the basic properties
Some of the basic properties display default values. You can modify these values if required.
To configure the basic properties:
- In the TrueSight Capacity Optimization console, navigate to Administration > ETL & System Tasks > and select ETL tasks.
- On the ETL tasks page, click Add > Add ETL under the Last run tab. The Add ETL page displays the configuration properties. You must configure properties in the following tabs: Run configuration, Entity catalog, and Google Cloud configuration
On the Run configuration tab, select Google Cloud Platform - GCP API Extractor from the ETL module list. The name of the ETL is displayed in the ETL task name field. You can edit this field to customize the name.

- Click the Entity catalog tab, and select one of the following options:
Shared Entity Catalog:Retain the default selection to share the entity catalog with the GCP Billing and Usage ETL, which extracts cost and usage data of your GCP resources.
- From the Sharing with Entity Catalog list, select the entity catalog name that is shared between ETLs.
- Private Entity Catalog: Select if this is the only ETL that extracts data from the GCP resources.
Click the Google Cloud configuration tab, and configure the following properties:
Property Description Service account key file directory Specify the path to the directory that contains the service account key files of projects. For example, <CPITHOME>/ServiceAccountKeyFiles/
This directory must be on the server where the ETL engine runs.
When you run the ETL, it uses all the service account key files (files that are in the valid JSON format) in this directory to collect data from your Google Cloud Platform project resources.
Business Service hierarchy If you want to view data of your GCP resources by business services, retain the default selection of Create Business Service hierarchy based on specified tag key. Specify the appropriate tag key name. For example, service.
Example scenario:
You have VMs that are tagged as follows:- AS1: {user=John, Purpose=Dev, Service=Data Solutions}
- vl-pub-bco-qa35: {user=Adam, Purpose=Production, Service=Data Solutions}
- vl-pun-bco-qa20: {user=Jane, Purpose=QA, Service=Data Solutions}
When you run the ETL, data is displayed in a hierarchy as follows:

If you do not use business services, data is displayed as follows:

The following image shows sample configuration values for the basic properties.
(Optional) Override the default values of properties in the following tabs:
- Click Save.
The details of the newly configured GCP API ETL are displayed.
(Optional) B. Configuring the advanced properties
You can configure the advanced properties to change the way the ETL works or to collect additional metrics.
To configure the advanced properties:
- On the Add ETL page, click Advanced.
Configure the following properties:
Property Description Metric profile selection Select the metric profile that the ETL must use. The ETL collects data for the group of metrics that is defined by the selected metric profile.
- Use Global metric profile: This is selected by default. All the out-of-the-box ETLs use this profile.
- Select a custom metric profile: Select the custom profile that you want to use from the Custom metric profile list. This list displays all the custom profiles that you have created.
For more information about metric profiles, see Adding and managing metric profiles
 .
.Levels up to Specify the metric level that defines the number of metrics that can be imported into the database. The load on the database increases or decreases depending on the selected metric level.To learn more about metric levels, see Aging class mapping
.Property Description Empty dataset behavior Specify the action for the loader if it encounters an empty dataset: - Warn: Generate a warning about loading an empty dataset.
- Ignore: Ignore the empty dataset and continue parsing.
ETL log file name The name of the file that contains the ETL run log. The default value is: %BASE/log/%AYEAR%AMONTH%ADAY%AHOUR%MINUTE%TASKIDMaximum number of rows for CSV output A numeric value to limit the size of the output files. CSV loader output file name The name of the file that is generated by the CSV loader. The default value is: %BASE/output/%DSNAME%AYEAR%AMONTH%ADAY%AHOUR%ZPROG%DSID%TASKIDCapacity Optimization loader output file name The name of the file that is generated by the TrueSight Capacity Optimization loader. The default value is: %BASE/output/%DSNAME%AYEAR%AMONTH%ADAY%AHOUR%ZPROG%DSID%TASKIDDetail mode Specify whether you want to collect raw data in addition to the standard data. Select one of the following options:- Standard: Data will be stored in the database in different tables at the following time granularities: Detail (configurable, by default: 5 minutes), Hourly, Daily, and Monthly.
- Raw also: Data will be stored in the database in different tables at the following time granularities: Raw (as available from the original data source), Detail (configurable, by default: 5 minutes), Hourly, Daily, and Monthly.
- Raw only: Data will be stored in the database in a table only at Raw granularity (as available from the original data source).
For more information, see Accessing data using public views
and
Sizing and scalability considerations.
Remove domain suffix from datasource name (Only for systems) Select True to remove the domain from the data source name. For example, server.domain.comwill be saved asserver. The default selection is False.Leave domain suffix to system name (Only for systems) Select True to keep the domain in the system name. For example: server.domain.comwill be saved as is. The default selection is False.Update grouping object definition (Only for systems) Select True if you want the ETL to update the grouping object definition for a metric that is loaded by the ETL. The default selection is False. Skip entity creation (Only for ETL tasks sharing lookup with other tasks) Select True if you do not want this ETL to create an entity and discard data from its data source for entities not found in Capacity Optimization. It uses one of the other ETLs that share a lookup to create a new entity. The default selection is False. Click Save.
The details of the newly configured GCP API ETL are displayed.
After you configure the ETL, you can run it to collect data. You can run the ETL in the following modes:
A. Simulation mode: Only validates connection to the data source, does not collect data. Use this mode when you want to run the ETL for the first time or after you make any changes to the ETL configuration.
B. Production mode: Collects data from the data source.
A. Running the ETL in the simulation mode
To run the ETL in the simulation mode:
- In the TrueSight Capacity Optimization console, navigate to Administration > ETL & System Tasks, and select ETL tasks.
- On the ETL tasks page, click the ETL. The ETL details are displayed.
- In the Run configurations table, click Edit
 to modify the ETL configuration settings.
 - On the Run configuration tab, ensure that the Execute in simulation mode option is set to Yes, and click Save.
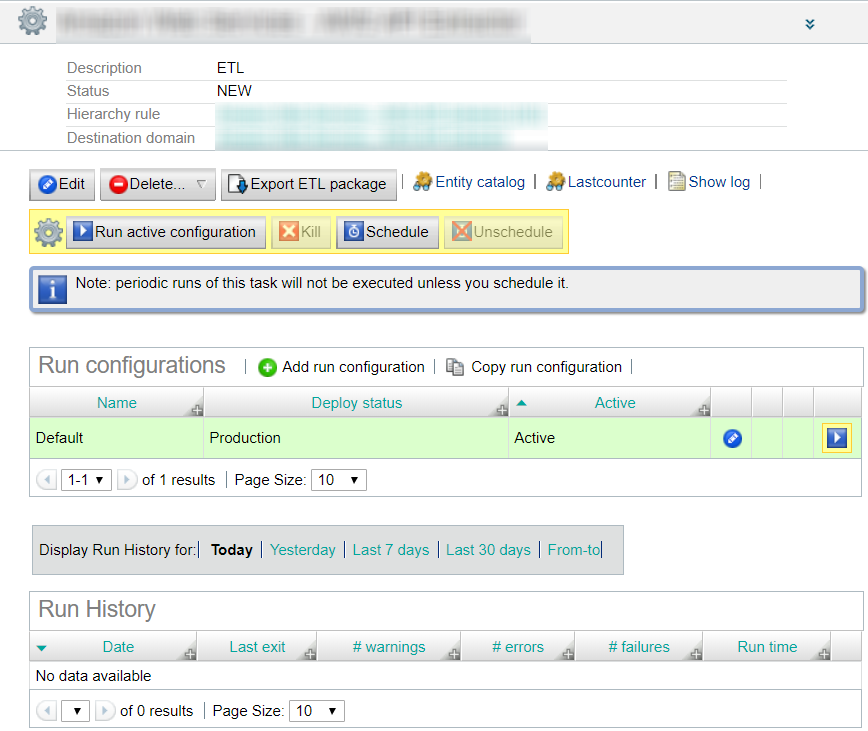
- Click Run active configuration. A confirmation message about the ETL run job submission is displayed.
- On the ETL tasks page, check the ETL run status in the Last exit column.
OK Indicates that the ETL ran without any error. You are ready to run the ETL in the production mode. - If the ETL run status is Warning, Error, or Failed:
- On the ETL tasks page, click
 in the last column of the ETL name row.
 - Check the log and reconfigure the ETL if required.
- Run the ETL again.
- Repeat these steps until the ETL run status changes to OK.
- On the ETL tasks page, click
B. Running the ETL in the production mode
You can run the ETL manually when required or schedule it to run at a specified time.
Running the ETL manually
- On the ETL tasks page, click the ETL. The ETL details are displayed.
- In the Run configurations table, click Edit to modify the ETL configuration settings. The Edit run configuration page is displayed.
- On the Run configuration tab, select No for the Execute in simulation mode option, and click Save.
- To run the ETL immediately, click Run active configuration. A confirmation message about the ETL run job submission is displayed.
When the ETL is run, it collects data from the source and transfers it to the TrueSight Capacity Optimization database.
Scheduling the ETL run
By default, the ETL is scheduled to run daily. You can customize this schedule by changing the frequency and period of running the ETL.
To configure the ETL run schedule:
- On the ETL tasks page, click the ETL, and click Edit. The ETL details are displayed.
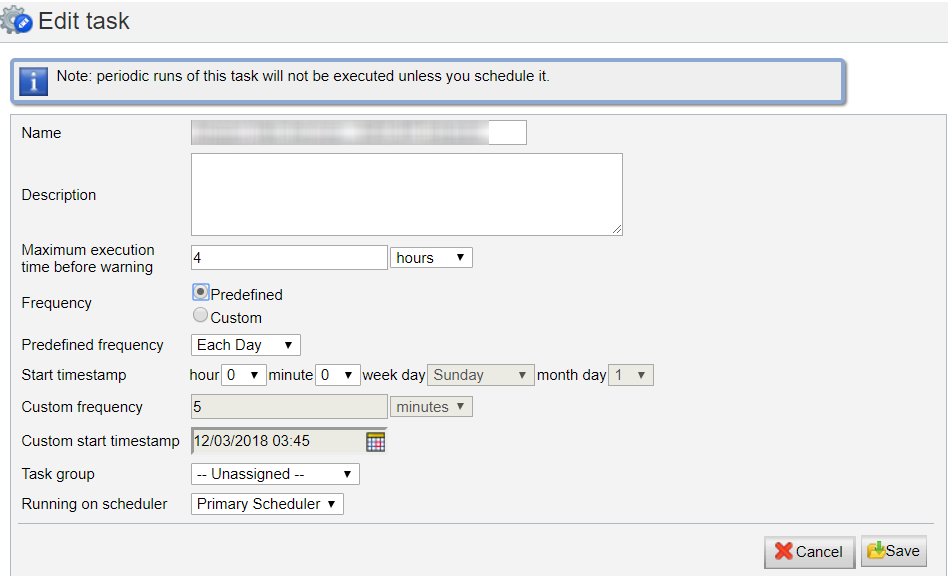
On the Edit task page, do the following, and click Save:
- Specify a unique name and description for the ETL task.
- In the Maximum execution time before warning field, specify the duration for which the ETL must run before generating warnings or alerts, if any.
- Select a predefined or custom frequency for starting the ETL run. The default selection is Predefined.
- Select the task group and the scheduler to which you want to assign the ETL task.
Click Schedule. A message confirming the scheduling job submission is displayed.
When the ETL runs as scheduled, it collects data from the source and transfers it to the TrueSight Capacity Optimization database.
Verify that the ETL ran successfully and check whether the GCP data is refreshed in the Workspace.
To verify whether the ETL ran successfully:
- In the TrueSight Capacity Optimization console, click Administration > ETL and System Tasks > ETL tasks.
- In the Last exec time column corresponding to the ETL name, verify that the current date and time are displayed.
To verify that the GCP data is refreshed:
- In the TrueSight Capacity Optimization console, click Workspace.
- Expand (domain name) > Business Services > (system name) > Instances.
- In the left pane, verify that the hierarchy displays your new and updated GCP instances.
- Click a GCP virtual machine instance, and click the Metrics tab in the right pane.
- Check if the Last Activity column in the Configuration data and Performance metrics tables displays the current date.
The following image shows sample metrics data. To learn more about these metrics and other related concepts, see Entities, lookup information, and metrics for Google Cloud Platform.
Comments
Log in or register to comment.