Batch PL/I Fault Diagnosis
This tutorial will guide you through some of the capabilities within BMC AMI DevX Abend-AID, including:
- Using BMC AMI DevX Abend-AID to examine a batch PL/I abend.
- Utilizing Abend-AID's features to view storage, compiled listings, variable values.
- Taking advantage of Abend-AID's link to BMC AMI DevX File-AID to view formatted VSAM, QSAM, etc., files.
Table of Contents
Starting BMC AMI DevX Abend-AID
To access Abend-AID for Batch within BMC AMI DevX Workbench for Eclipse:
Do This
- Click on the BMC dropdown.
- Click on Operations.
- Click on Abend-AID.
- Click on TestDrive.
The Abend-AID Logon view opens in the bottom pane.
- Double-click the tab for the Abend-AID view to maximize the pane.
- Enter your Test Drive ID and password, and then press enter.


This opens a view into Abend-AID within your BMC AMI DevX Workbench for Eclipse IDE. Integration of the tools needed for developers to do their daily jobs is a key feature of the Workbench experience.
The main menu of Abend-AID is the gateway to many useful views of your Fault Analysis data. We'll start by looking at the Fault Summary of a specific job (CWEZXXX1) to spotlight how you can leverage Abend-AID to quickly understand the root cause of a reported abend.
Do This
When successfully logged on, you are taken to the Abend-AID main menu.
- Click on 'Fault Summary'.


Fault Summary provides you easy, hyperlinked access to your generated batch, CICS, IMS, and SVC dumps sortable by job name, CICS region name, IMS message region name, etc. Each column provides a masking field (asterisks) to shorten the time needed to find your dump.
Do This
- Type CWEZ into the masking field in the Job Name column and press <Enter>.


You now have filtered to only jobnames that begin with CWEZ. Next, we'll dig a little deeper using Abend-AID's hyperlinks.
Do This
- Click on the 'CWEZXXX1' hyperlink.


We've now filtered down to entries only for jobname CWEZXXX1 (in this case, just one entry). Next we'll select the only available entry to begin diagnosing an abend.
Do This
You can access an Abend-AID report using a couple of methods.
- Click on entry 0017662 to view the Diagnostic Summary.
OR
- Click the menu icon (circled in red) to the left of entry 0017662 to display the dropdown menu.
- Select 'Diag' to view the Diagnostic Summary.


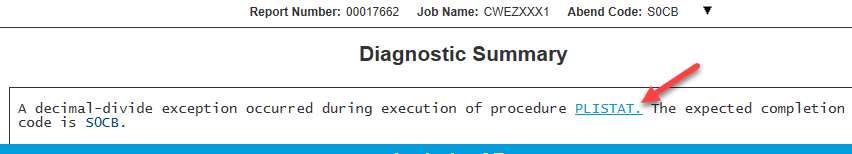
The Diagnostic Summary
The Diagnostic Summary provides the information needed to diagnose a batch program error. The summary analyzes the abend, provides a probable reason why it occurred, and usually suggests a resolution. For COBOL, PL/I, and Assembler programs compiled with source support, the statement number and source code of the statement in error are shown.
We'll use the Diagnostic Summary as a window into details about the program, the listing, storage areas, a narrative explanation of the error code, and other information valuable in diagnosing an abend.


Do This
- In the first line of the Diagnostic Summary, click the 'PLISTAT' hyperlink and we'll start diagnosing a PL/I abend.
Program Detail Screen
The Program Detail screen provides detailed information about the selected program and gives you hyperlinks to source listings, concatenations and storage areas.

Do This
- Click on the 'STEPLIB' hyperlink.


The STEPLIB Concatenation screen displays the datasets and their associated volsers for the JOBLIB or STEPLIB DD statement defined in the JCL at the time of this abend. The highlighted dataset name is the load library from where the module was loaded.
Do This
- Press <F3> to return to the Program Detail screen, then click the 'Listing' hyperlink to view the compiled listing.


The Program Listing screen displays the source listing statements of the selected program, identifying the active statement (abending offset, program call, and so forth) with a highlighted line.
To see the complete instruction, you must back-up one page.
Do This
- Click on 'Previous' to back-up one page.


Do This
- Press <F3> to return to the Program Detail screen, then click on the 'Storage Areas' hyperlink.


This screen displays the variables in storage and their values at the time of the abend. Our example contains a large table.
Do This
- Let's move to the end of the list by clicking the last page (148 in our example).


You are now placed at the end of the list. We can dig a little further into the individual fields for more useful information.
Do This
- Click the value of FIELD_CALC hyperlink X'3765'.


Displayed is the Expanded Data Field screen showing the value in both zone decimal and in character mode. This section is especially helpful when a field contains a mixture of display, binary, and packed decimal fields.
Do This
- Press the <F3> key three times to return to the Diagnostic Summary.
To summarize, the Diagnostic Summary screen provides an extensive amount of information to begin fault analysis, and it also adds hyperlinks to additional information.
- The abending line of code is displayed. The line number is hyperlinked. As we saw earlier, clicking the line number will put you into the Program Listing.

- The variables comprising the line of code, along with their picture types and values at the time of the abend. The values provided are hyperlinks to the Expanded Data Field screen.

- Abend-AID produces for you a narrative explanation of the abend and IBM messages that accompany the abend.

- The Program Information subsection provides information about the load library or program object library the module was loaded from, the bind date/time, with hyperlinks to the Program Detail screen and the STEPLIB Concatenation screen.

- The Last Call or I/O Request subsection provides information about the last program call or I/O statements executed prior to the abend and the paragraph where the statement resided.

- The Call Trace Summary spells out the sequence of programs called from the initial program to the abend. Hyperlinks take you to the Program Detail screen for each program, or to the Program Listing screen for each hyperlinked offset.

Do This
- Click on 'PLISTAT' to return to the Program Detail screen.

Clicking any hyperlinked program name takes you to the Program Detail screen for that specific program.
Do This
- Press <F3> to return to the Diagnostic Summary, then click x'210' (found under the 'Return Value' column).


The argument definitions and values for the call are displayed.
Do This
- Press <F3> to return to the Diagnostic Summary, scroll down to the Supporting Information section, then click on 'MODS'.


Here you can see all the module names, libraries from which they were loaded, for all programs (both application and LE) that appear in the calling chain. Abend-AID indicates when modules are loaded from the LINKLIST and details the library set to help with your diagnosis.
Do This
- Press <F3> to return to the Supporting Information of Diagnostic Summary, then click on 'LIBR'.


This is another path to the STEPLIB Concatenation (earlier we used a hyperlink from the Program Detail screen). As you saw previously, the library from where the modules loaded is highlighted.
Do This
- Press <F3> to return to the Supporting Information of Diagnostic Summary, then click on 'JES'.


If your system runs JES2, Abend-AID shows you the submitted JCL that produced the abend.
Do This
- Press <F3> to return to the Supporting Information screen, then click on 'PROG'.

Program Summary Screen
The Program Summary Information screen identifies all active modules involved in an abending transaction. Key identification data is summarized for each module used by a transaction up to the abending module. This screen allows you to quickly verify whether the correct version of a module is in use.

Do This
- Click on the menu icon (see inside the red circle) next to program 'PLISTAT'.

From here you again have links to extensive information about the application programs that comprise the active calling chain:
- The Program Detail, Program Listing and Program Storage options have been covered previously.
- Clicking on the Compiler Options shows the language and version the program was compiled or assembled under, as well as the compile options (if the program was compiled with COBOL).
- The remaining options are specific to language(s) other than PL/I.
Wrap-up
This concludes our look at how Abend-AID provides powerful tools for diagnosing PL/I batch abends. We hope that you have enjoyed your look at these capabilities and look forward to working with you to implement some or all of the solution within your systems. Please remember to complete the Test Drive survey, as both your sponsor and our team are very interested in your feedback on the Test Drive Experience.
You can choose from any of the available scripts from the panel to the left or return to the main page here: Welcome to Test Drive
Comments
Log in or register to comment.