Viewing collected data
View collected data on the Monitoring > Devices page. As an administrator or operator, use this data to learn about the monitored environment and correlate, analyze, and prioritize IT operations. Click a device name to view the associated Device Details page. The Event Summary area displays a matrix of events that are associated with the device.
A device is any entity that can be monitored by BMC Helix Operations Management . A device is created when you define monitor policies and the monitoring begins.
BMC Helix Operations Management collects data from sources. Built-in algorithms convert the information collected about entities into devices, determine whether two or more pieces of data refer to the same entity, and consolidate those entities into a single device.
The source for devices are PATROL Agents. Note that the PATROL Agent itself is treated as a device, in addition to any systems it monitors remotely. When a monitoring policy is applied to a PATROL Agent, its device is automatically added. Device monitors are a way of classifying the data that is to be collected. They continuously monitor various parameters of the device. For example, CPU performance and memory utilization for OS monitoring.
The following illustrations provide an overview of the information that you can view and the actions that you can perform through the Devices page.

- Access the main action menu to set preferences.
- Filter devices by type.
- Filter devices by status.
- Filter devices by severity.
- View the list of devices.
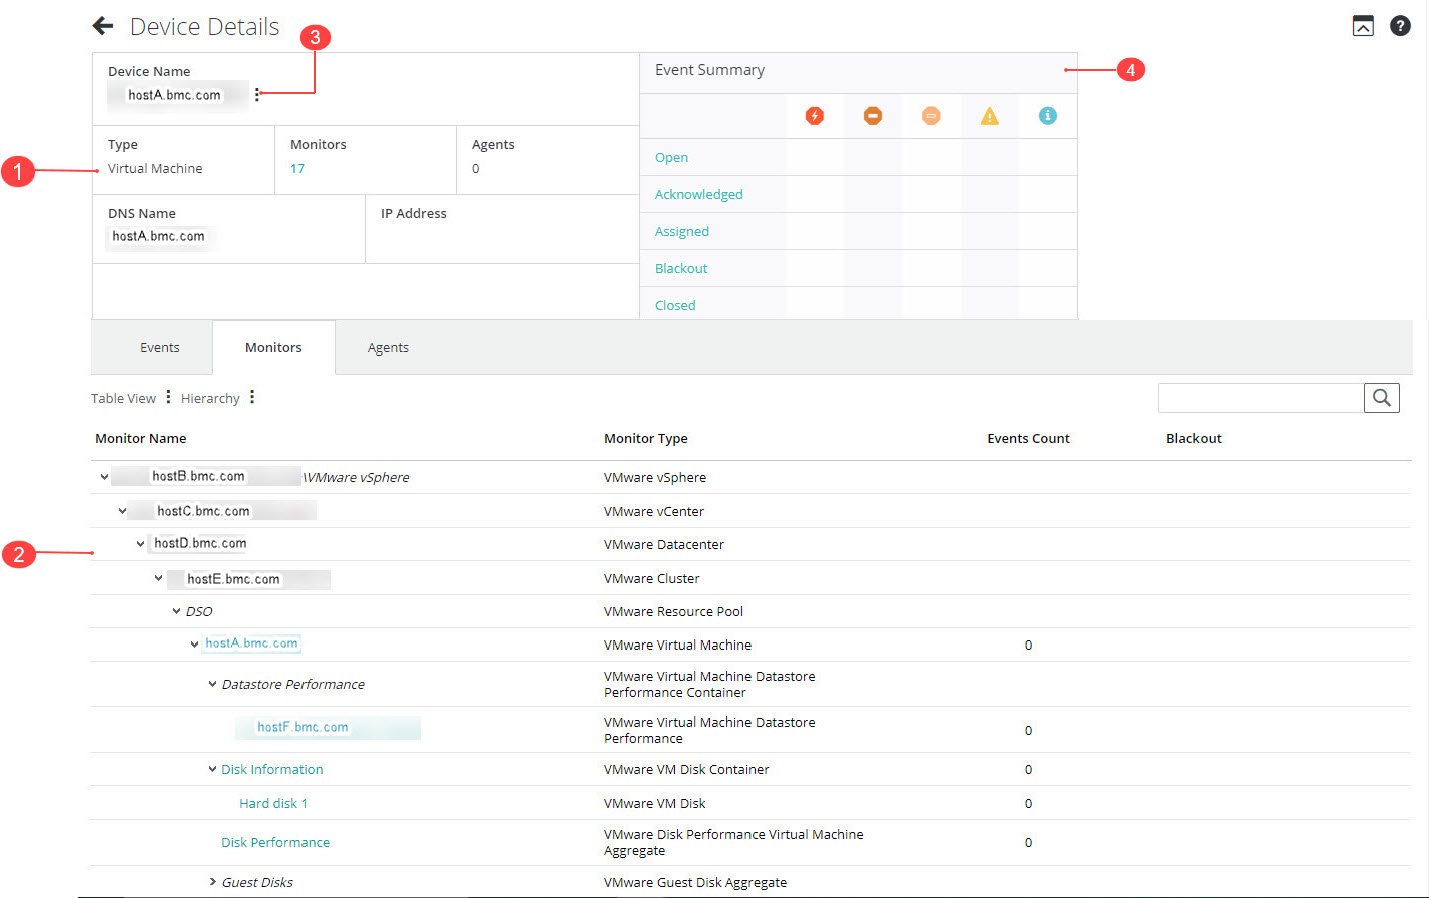
- View device details.
- View the list of device monitors.
- Launch the Metrics Data dashboard in BMC Helix Dashboards .
- View the event summary area.
By default, all users can access all devices. To control access of devices to limited users, see Setting up access control.
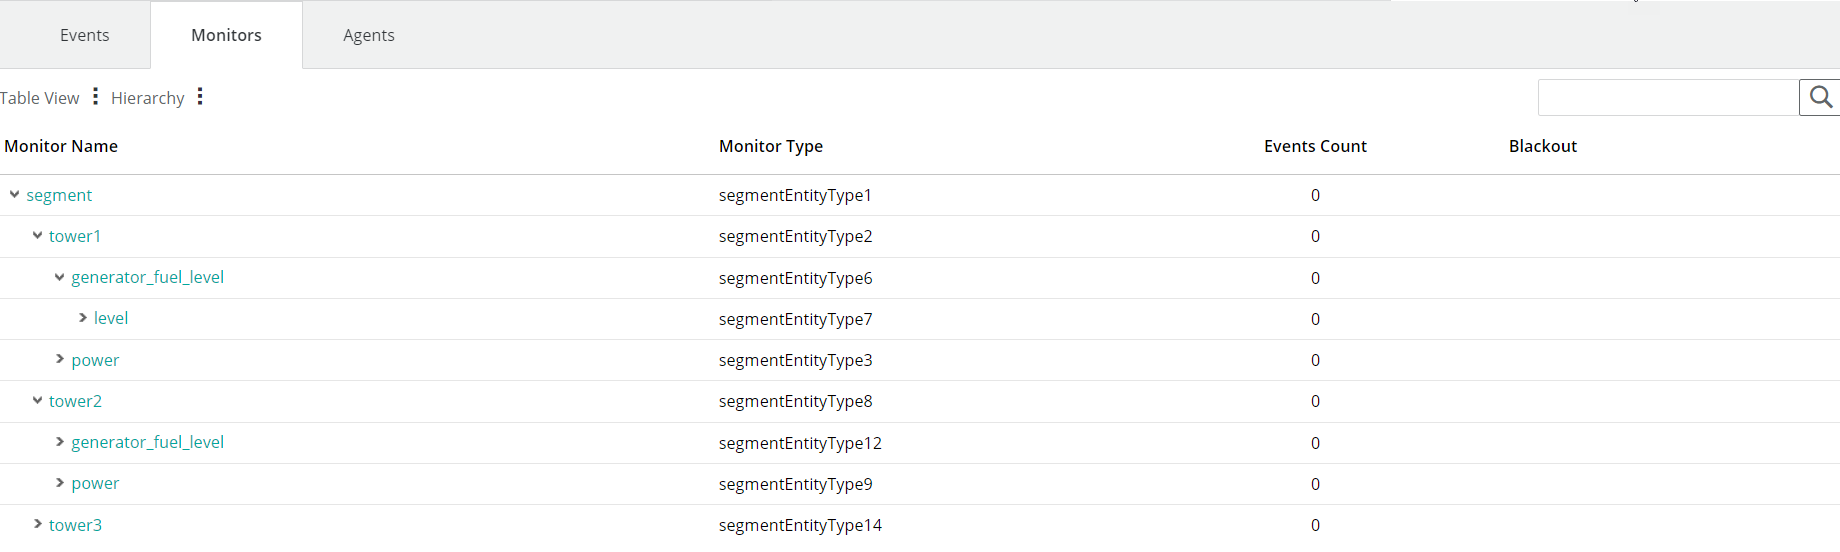
You can also view third-party devices in a hierarchical structure.
When authorization profiles are set up in your product, you can view a device if the device belongs to your profile. Administrators manage authorization profiles. For more information, see Configuring authorization profiles.
When you click a monitor name or an application class being monitored for a monitor (for example, Cache for Windows Operating System), the details of the monitor are displayed on the Monitor Details page. This page shows the following details:
- Monitor name or application class details
- Summary of the events created for the monitor name and its attributes
- List of the events created for the monitor name and options to perform actions on an event
- Performance overview of the attributes collected for the class where you get the following options:
- Configure time period to view performance
- Compare multiple metrics and view output on a graph
- Show performance of a single metric on a graph

Customize monitor graphs to leverage the BMC Helix Operations Management data visualization capabilities.
To customize monitor graphs
From the Monitors tab, click a monitor to view its details. The default Performance Overview tab provides a graphical overview of the monitor. You can view graph data by customizing following actions:
- Specify the time period for the graph.
- Select a graph type — multimetric or single metric.
- For a multimetric graph, select the metrics to compare and set the left- and right-axis attributes.
- For a single metric graph, select Edit Settings and select the monitor metric from the list and configure it:
- Select Baselines to view hourly high and hourly low baselines on the graph (calculated weekly for the CPU monitor only)
- Select threshold indicators for the data you are viewing. Thresholds have to be previously set for the metric in Alarm policies.
- Specify if you want to include intelligent events. BMC PATROL Agent events that are associated with monitors are also considered intelligent events.
- Specify if you want to view the hourly highest or lowest values in the specified graph period. The peak or low indicators can be selected only when data has been collected for more than 24 hours.
For single metric analysis, display of alarm thresholds on the monitor graph is determined in the following order:
- Alarm policy configured with the Multi Instances option and the highest precedence
- Alarm policy configured with the All Instances option and the highest precedence

The graph legend shows if the alarm thresholds are shown from a policy created with Multi Instances (Instance Threshold) or All Instances (Global Threshold).
If thresholds are set for a metric, the graph is displayed in the severity color for the threshold range. This allows you to visualize the metric performance using the severity colors.

If baseline is selected for the CPU metric, the graph shows the hourly high and hourly low baselines. When the metric breaches the high or low baseline, an event is generated.

You can export a graph to PDF or CSV format. The PDF format replicates the graph that is displayed in the Performance Overview tab. The CSV format contains values for the selected metrics.
To view data in BMC Helix Dashboards
For BMC Helix Operations Management , use out-of-the-box dashboards to quickly start creating visualizations to get an insight of your IT infrastructure. The following out-of-the box dashboards are available:
-
Event Data dashboard

As a tenant administrator, editor, or viewer, you can use the Event Data dashboard to view the number of open events and their severity, and the number of closed events. The dashboard also displays the trend of open events in your environment. -
Metrics Data dashboard
As a tenant administrator, editor, or viewer, you can use the Metrics Data dashboard to view the performance metrics data of the devices in your environment and get an insight into the their health.
Comments
Log in or register to comment.