GCP VM Instances view
The GCP VM Instances view provides detailed information on VM instances in the Google cloud environment.
To access the GCP VM Instances view, in the navigation pane of Views tab, select Views > Cloud > GCP > GCP VM Instances.
Settings
You can use the Settings page to configure the settings for all pages in the GCP VM Instances view. To access this page, on the GCP VM Instances view page, select ![]() > Edit Settings.
> Edit Settings.
Important
Any configurations done in the Maps Settings will not have an impact on the GCP view. The Maps page is not available in BMC Helix Continuous Optimization 22.1 version.
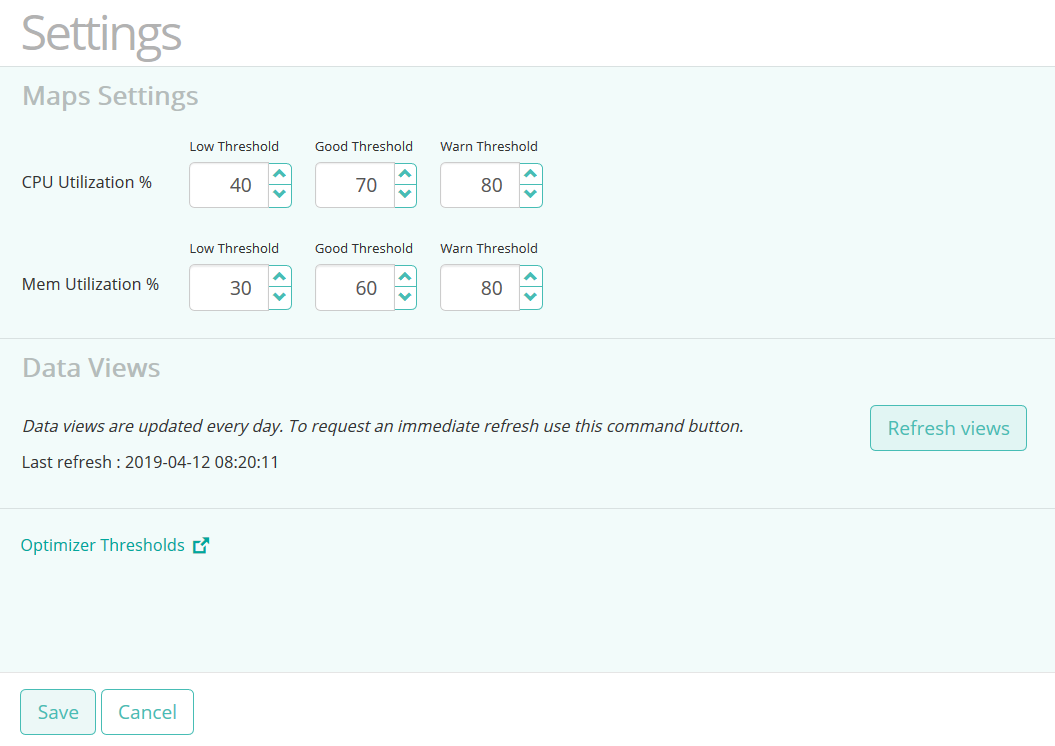
Maps Settings
- CPU Utilization %: Modify the required values for displaying the threshold values for the CPU utilization in the Maps page:
In the Low Threshold box, edit the threshold value for CPU utilization in percentage. The entities with capacity starting from 0 to value below the value in this box are displayed in the shades of blue color.
In the Good Threshold box, edit the threshold value for CPU utilization in percentage. The entities with capacity starting from the value in the Low Threshold box to the value below the value in this box are displayed in the shades of green color.
- In the Warn Threshold box, edit the threshold value for CPU utilization in percentage. The entities with capacity starting from the value in the Good Threshold box to the value below the value in this box are displayed in the shades of yellow color.
The entities with capacity above the value in the Warn Threshold box are displayed in the shades of red color.
- Mem Utilization %: Modify the required values for displaying the threshold values for the memory utilization in the Maps page:
In the Low Threshold box, edit the threshold value for memory utilization in percentage. The entities with capacity starting from 0 to value below the value in this box are displayed in the shades of blue color.
In the Good Threshold box, edit the threshold value for memory utilization in percentage. The entities with capacity starting from the value in the Low Threshold box to the value below the value in this box are displayed in the shades of green color.
- In the Warn Threshold box, edit the threshold value for memory utilization in percentage. The entities with capacity starting from the value in the Good Threshold box to the value below the value in this box are displayed in the shades of yellow color.
The entities with capacity above the value in the Warn Threshold box are displayed in the shades of red color.
Other Settings
- Setting to show the number of VMs which have been idle for the specified number of days.
- Setting to specify the number of days for which the VM has been idle.
- Optimization Behavior setting:
Optimization behavior Description Aggressive Resource utilization in the server is computed by considering the average value of hourly samples. Increases in the resource utilization within the hour are not considered. Then, the 95th percentile of the hourly value over the last 30 days is computed for each resource to generate the configuration of the target virtual machine or instance type.
Balanced (Default) Resource utilization in the server is computed by considering the 90th percentile value of hourly samples. Only 10% of increases in the utilization within the hour are not considered. Then, the 95th percentile of the hourly value over the last 30 days is computed for each resource to generate the configuration of the target virtual machine or instance type.
Conservative Resource utilization in the server is computed by considering the 99th percentile value of hourly samples. Only 1% of increases in the utilization within the hour are not considered. Then, the 95th percentile of the hourly value over the last 30 days is computed for each resource to generate the configuration of the target virtual machine or instance type.
If you select the Conservative or Balanced optimization behavior for a server that is not instrumented, the results are based on the Aggressive behavior.
BMC recommends the Conservative behavior for servers that are running business-critical applications.
Data Views
Displays the details when the view was last refreshed. Click Refresh views to refresh the GCP views. After you click this button, all views are scheduled for materialization.
The Refresh views option is available only if your user role has permissions to edit the view. For more information about permissions, see Configuring authorization profiles.
Optimizer Thresholds
Click the link to modify the threshold of a metric or an indicator. For more information about configuring the thresholds, see Configuring and managing thresholds for metrics and indicators.
Comments
Log in or register to comment.