Viewing configuration item details
For detailed analysis and remediation, the Configuration Items Monitoring page provides you with comprehensive information about each configuration item (CI).
Before you begin
To view the Configuration Items Monitoring page and to take action, make sure your TrueSight Infrastructure Management server is registered with TrueSight Presentation Server.
To view CI details
- In the TrueSight console, select Monitoring > Configuration Items.
- To view the CI details on the Configuration Items Monitoring page, use one of the following methods:
- Click a CI.
- Right click a CI and select Open link in new tab.
- Right click a CI and select Open link in new window.
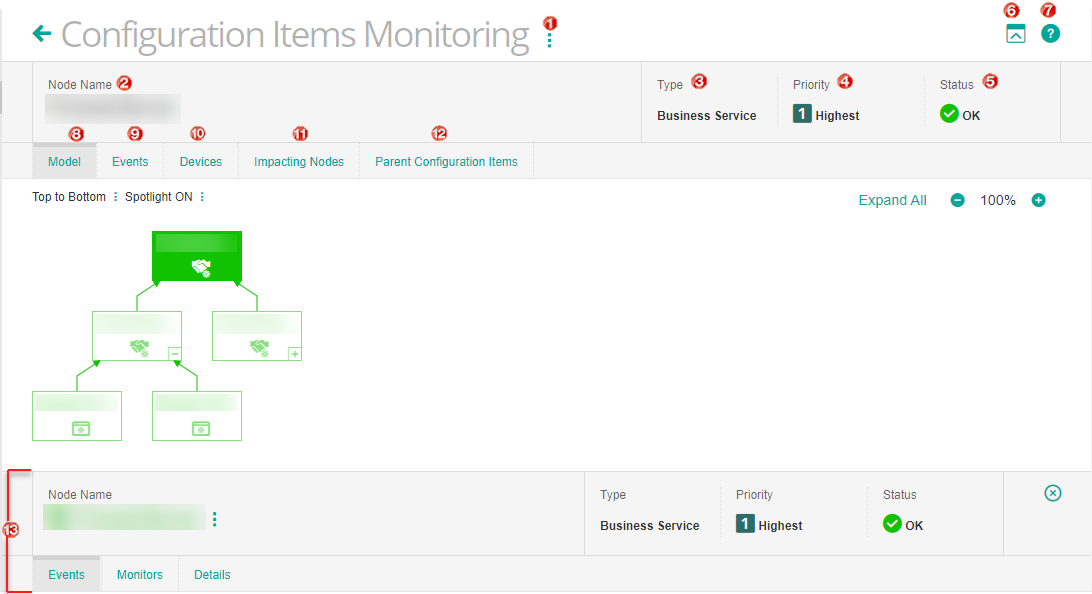
The following figure depicts a snapshot of the Configuration Items Monitoring page:
User goals and features
The Configuration Items Monitoring page provides you with the capabilities for addressing the following business goals:
| Goal | Description and reference |
|---|---|
| Customize the CI details view to suit your preferences | From the action menu , select Save as Preference. Every time you log on to the TrueSight console and navigate to the Configuration Items Monitoring page, the settings that you last used are displayed. This feature applies to the Model, Events, and Devices tabs. |
| To view the node name, type, priority, and status | Action menu displays the CI node name. Action menu displays the CI type. There are different CI Types such as Business Service, Activity, Application, Application System and so on. Action menu displays the CI priority. The priorities defined for a CI are as follows: Highest, High, Medium, Low, Lowest. Action menu displays the CI status. The statuses defined for a CI are as follows: Unavailable, Impacted, Minor Impact, Warning, Information, OK, Unknown, and Blackout. |
| Hide the CI details to gain more display area for the service model | Use the Collapse Summary icon to collapse the CI details area. Toggle between displaying and hiding the CI details area by using this option. |
| To view the service model associated with the CI | Click the Model tab to view the service model associated with the CI. The service model displays all the nodes associated with the CI. You can pinpoint the exact impact area in a service model and drill down to each CI and find its status. For information about service models, see Viewing a service model from the TrueSight console. |
| To view the events associated with the CI | Click the Events tab to examine all the events associated with the CI as a snapshot of the Events view. For more information about events, see Monitoring and managing events. |
| To view the devices associated with the CI | Click the Devices tab to examine all the devices associated with the CI as a snapshot of the Devices view. For more information about devices, see Monitoring devices from the TrueSight console. Note The Devices tab applies only to computer system CIs and not to the other CIs. |
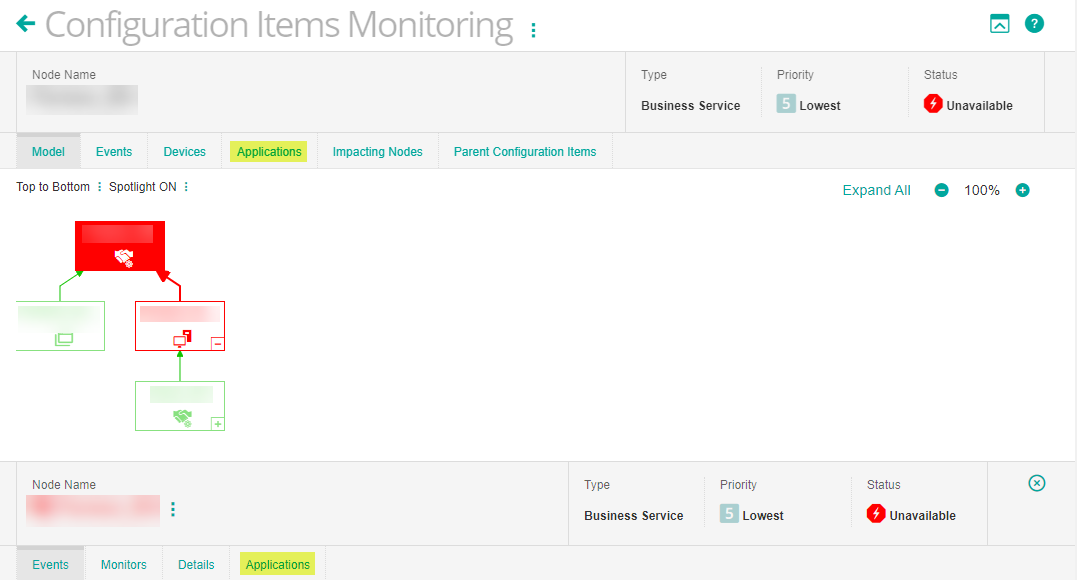
| To view the applications associated with the CI | The applications associated with the selected CI if any are displayed in the Applications tab. For more information see, To view the applications associated with the CI. |
| To view the nodes directly impacting the CI | Click the Impacting Nodes tab to examine all the nodes which are directly impacting the CI. The tab displays all the impacted nodes in a tile view. When you click an individual node, it displays the details associated with that node in drill-down area . For more information, see Viewing a service model from the TrueSight console. |
| To view all the parent CIs of the selected node of a service model | Click the Parent Configuration Items tab to examine all the parent CIs of the selected node in a service model. This feature helps the services operator to view all the potential parent CIs that may get impacted or that have already been impacted by the selected node. |
| To view the drill-down details for the selected CI | Click the required CI in the service model hierarchy for which you want to view the CI drill-down details. The CI drill-down details for the selected CI are displayed in the drill-down area . For more information see, Viewing a service model from the TrueSight console. |
| Launch context sensitive help | Click the help icon to launch the context-sensitive help. By default, the online version of the documentation is displayed. |
To view the applications associated with the CI
- In the TrueSight console, select Monitoring > Configuration Items.
- To view the CI details on the Configuration Items Monitoring page, use one of the following methods:
- Click a CI.
- Right click a CI and select Open link in new tab.
- Right click a CI and select Open link in new window.
- Click the Applications tab in the Configuration Items Monitoring page to view the applications associated with the selected CI as shown in the following illustration:


Comments
Is it possible to view related (to CI) incidents, changes and problems?
Hi Jan Israelsson,
Our SME had the following inputs:
We do not show all those views in the TSPS UI, for that users need to go to the ITSM Console. If there are any incidents generated, then those can be seen on the Events page.
Hence, closing the comment based on the SME's inputs.
Regards,
Shreya
Hi Jan, We do not show all those views in TSPS UI. For that user need to go to ITSM Console. If there are any incidents generated that can be seen in events page.
Hi and thanks! I'm not an experienced TS user so please excuse me if I'm not describing things correctly. But what I would like to know is if RCA is assisted somehow with information from ITSM, lets say events arrives from a specific CI, can you then (in TS) visualize if there are open incidents or changes related to the same CI?
Regards, Jan
Hi Jan Israelsson,
Our SME had the following inputs:
If there are any open incidents for the CI, those events and tickets get associated with that CI in TS and its status changes from OK to Major/Minor based on the highest event severity. Also there is relationship created between the event and the incident generated.
Regards,
Shreya
Hi Jan Israelsson,
Do let us know if this answers your query.
Regards,
Shreya
Hi, Thank you for the answers, I have no more questions.
Regards, Jan
Sure thanks Jan Israelsson. Closing the comment.
Regards,
Shreya
Hi Jan, If there are any open incidents for the CI, those events and tickets gets associated with that CI in TS and its status changes from OK to Major/Minor based on the highest event severity. Also there is relationship created between the event and the incident generated.
When applying a blackout in the Presentation Server, why is it not reflected in the Configuration items?
Hello Julian Terron flores,
Please provide us some more information. What type of blackout policy you created and so on.
There is a blackout policy creation video here to check as well.
Log in or register to comment.