Viewing monitor information in the TrueSight console
You use the Monitor Details page to view detailed information about each monitor.
Complete the following steps to view the Monitor Details page:
- In the TrueSight console, navigate to Monitoring > Devices to open the Devices page.
- Click a device to view the Device Details page for the device.
- In the Monitor Name column, click a monitor name to view the Monitor Details page for the monitor. View the monitor type, associated device and PATROL Agent, data and event streaming status, and monitor data collection status.
Viewing the performance overview of the monitor
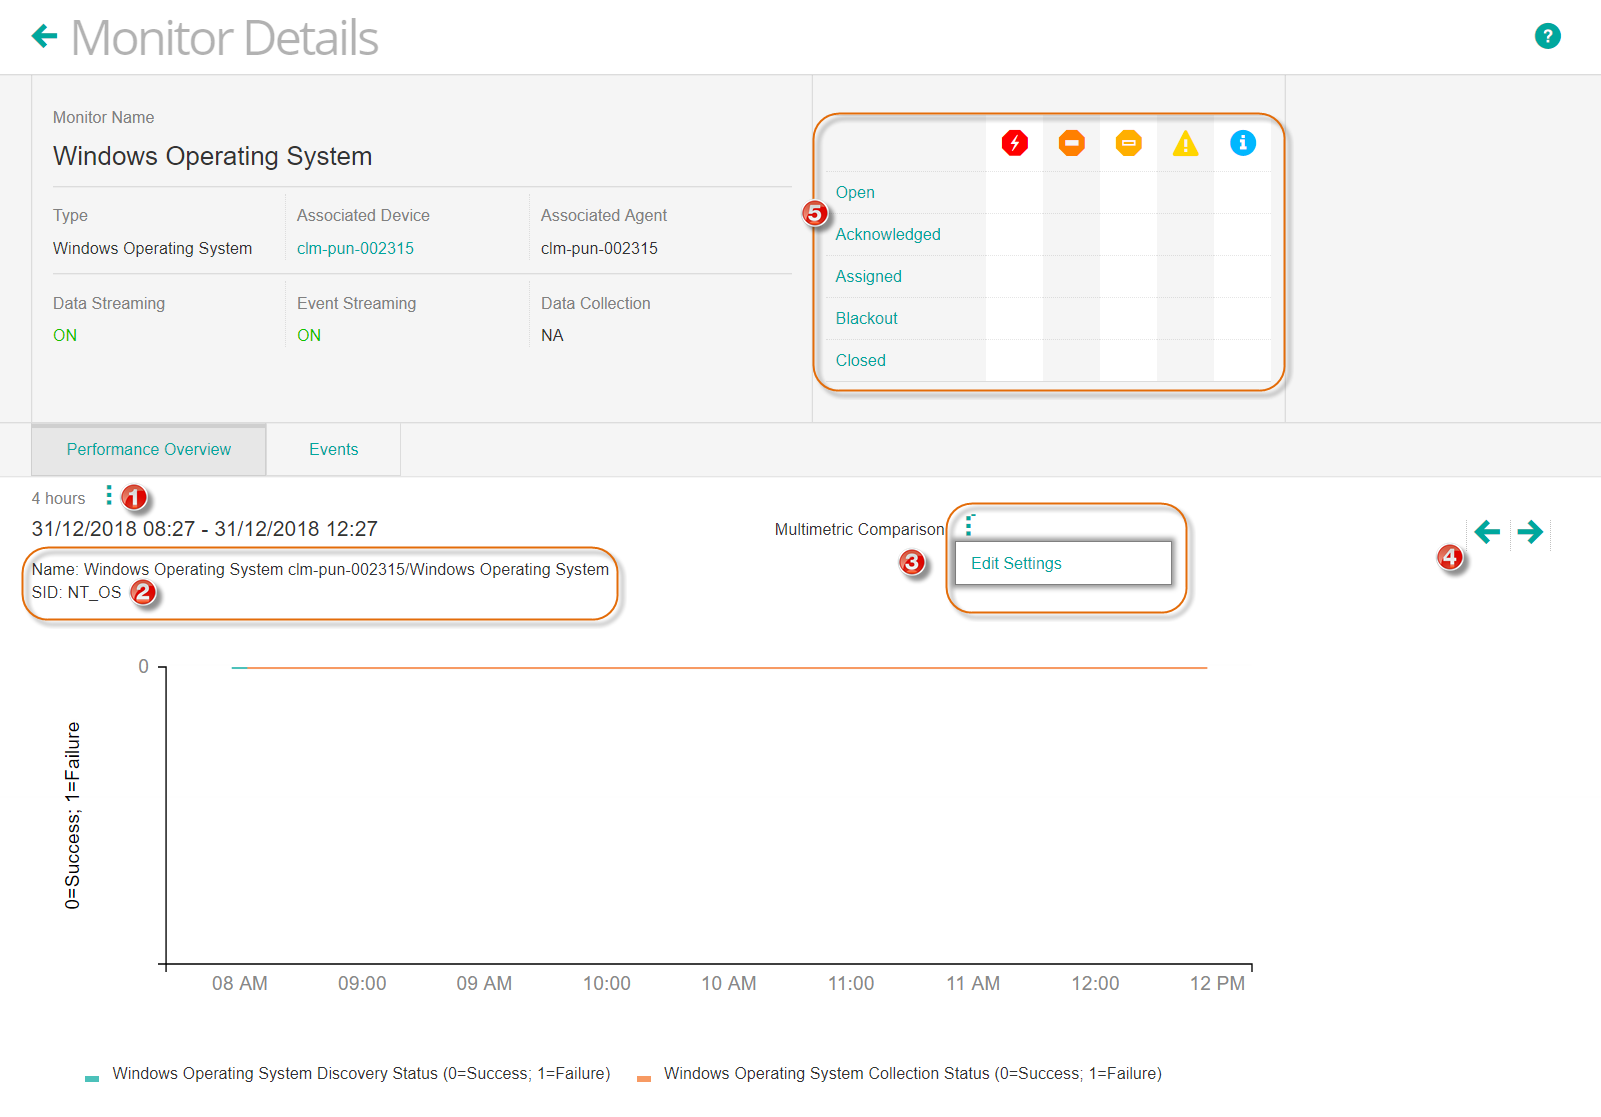
On the Monitor Details page, the default tab is the Performance Overview tab, which is a graphical overview of the monitor. The following table describes the items in the Performance Overview tab.
| Item | Description | |
|---|---|---|
| Time period | Time period for which to display the graph. The default is 4 hours. Choose a predefined time period or create your own custom time period. | |
| Name and SID | Displays the Monitor name and Instance SID name. |
| Graph options | Select Edit Settings to customize the graph. See Customizing the graph for more information. |
| Previous/next time period | View the graph for the previous or next time period that you have set in (1) |
| Status and Severity matrix | The matrix that displays a brief summary of event status with severity. You can click the link under each status to view details. |
Note
- If the selected time period contains a single data point, no graph is drawn. You cannot view this data point if data markers for graphs is disabled. To view the data point, enable the Show Data Markers option in the Devices Preferences page.
- The Monitor Name in the graph shows the absolute path, only when Show absolute path for the Monitor Instances is enabled under
Setting user preferences

For example,
If Show absolute path for the Monitor Instances is not enabled, the path is displayed as <Server Host Name>/Services
If Show absolute path for the Monitor Instances is enabled, the path is displayed as Windows Process <Server Host Name>/Services. Notice the Windows Process and /Services Paging in the path.
To view events using the events matrix
The event status and severity matrix ![]() displays the number of events in each status and severity.
displays the number of events in each status and severity.
Click any event count in the matrix to view the relevant events in the Events tab.
Note
To display the non-English monitor types and attributes, stop and restart the Presentation Server after you import the Central Monitoring repository:
From the <installation directory>\truesightpserver\bin folder, execute the following commands:
tssh server stop
tssh server start
On Linux computers, add & at the end of the tssh server start and tssh server stop commands so that the process runs in the background and you can continue to use the shell.
Customizing the graph (applicable only to versions 11.3.03 and later)
You can dynamically change the metric or other graph data by using the graphing options. To customize the graph:
- On the Monitor Details page, make sure you are viewing the Performance Overview tab.
- Select a time period for your graph by clicking
 next to the time period area.
 - Click next to Multimetric Comparison and click Edit Settings.
Select one of the following graph types:
Multimetric Comparison. In this option, you can simultaneously view a graphical analysis of multiple metrics.
Single Metric Analysis. In this option, you can view a graphical analysis of a single metric.
- If you select Multimetric Comparison, select the correct options for the left axis and the right axis of the graph in the Left Axis and Right Axis lists.
If you select Single Metric Analysis, select indicators for the following parameters:- Baselines
- Thresholds
- Events
- Graph Data
PATROL Agent
- Click Apply to view the graph.
The following table provides details about the graphing options.
| Option | Description |
|---|---|
| Graph Type | Select one of the following:
|
| Metric | For a single metric analysis, select the monitor metric from the list or select the metrics to compare for a multimetric comparison. Set the left- and right-axis attributes for a multimetric comparison. Metric for Cell HA Monitoring Configuration
Note: This is applicable only if you deployed the Custom KM. For more information, see
Configuring Self-Health Monitoring for data and events out of synchronization using Cell Monitoring KM.
|
| Options for single metric analysis only | |
| Baselines | There are two baselines: Baseline High and Baseline Low. Baseline High represents the point at which 95% of the weighted average of the historical values fall below this value for the selected time period. Baseline Low represents the point at which 90% of the weighted average of historical values for the selected time period fall above this line. Baseline indicators always use the current week as baseline data. The baseline indicator is recalibrated for each hourly point per week. Select All to show condensed Baseline High and Baseline Low for hourly, daily, and weekly baseline values. |
| Thresholds | If thresholds have been set for the data type that you are viewing, check boxes are displayed. These indicators show you the event settings relative to the performance of the data you are viewing. |
| Events | Show Intelligent Events: Displays any intelligent events on the selected attributes and for the selected duration. PATROL Agent events that are associated with monitors are also considered intelligent events. Show Abnormality: Displays any events on the selected attributes and for the selected duration. Show External Events: Displays any events raised by a change entry, SNMP trap, or external events. |
| Graph Data | Hourly Maximum: Highest values of data found for the specified graph period. Peak indicator can be selected only when viewing data that is older than 24 hours. Hourly Minimum: Lowest values of data found for the specified graph period. Low indicator can be selected only when viewing data that is older than 24 hours. Period Maximum: Displays highest attribute value on the Y-axis. Period Minimum: Displays lowest attribute value on the Y-axis. Period Average: Displays average attribute value of all points of Period Minimum and Period Maximum attribute values. |
PATROL Agent (applicable only to 11.3.03 and later versions) | Obtain Data: Reads and displays the performance metrics data directly from PATROL Agent. Show Annotations: Displays any annotations on the selected attributes and for the selected duration. Note Annotations longer than hundred characters are truncated beyond the first hundred characters. Show Thresholds: Obtains and displays the PATROL Agent Threshold data. Info
|
Customizing the graph (applicable only to versions 11.3.02 and earlier)
You can dynamically change the metric or other graph data by using the graphing options. To customize the graph:
- On the Monitor Details page, make sure you are viewing the Performance Overview tab.
- Select a time period for your graph by clicking next to the time period area.
- Click next to Multimetric Comparison and click Edit Settings.
Select one of the following graph types:
Multimetric Comparison. In this option, you can simultaneously view a graphical analysis of multiple metrics.
Single Metric Analysis. In this option, you can view a graphical analysis of a single metric.
- If you select Multimetric Comparison, select the correct options for the left axis and the right axis of the graph in the Left Axis and Right Axis lists.
If you select Single Metric Analysis, select indicators for the following parameters:- Baselines
- Thresholds
- Events
- Graph Data
PATROL Agent Data
- Click Apply to view the graph.
The following table provides details about the graphing options.
| Option | Description |
|---|---|
| Graph Type | Select one of the following:
|
| Metric | For a single metric analysis, select the monitor metric from the list or select the metrics to compare for a multimetric comparison. Set the left- and right-axis attributes for a multimetric comparison. Metric for Cell HA Monitoring Configuration
Note: This is applicable only if you deployed the Custom KM. For more information, see
Configuring Self-Health Monitoring for data and events out of synchronization using Cell Monitoring KM.
|
| Options for single metric analysis only | |
| Baselines | There are two baselines: Baseline High and Baseline Low. Baseline High represents the point at which 95% of the weighted average of the historical values fall below this value for the selected time period. Baseline Low represents the point at which 90% of the weighted average of historical values for the selected time period fall above this line. Baseline indicators always use the current week as baseline data. The baseline indicator is recalibrated for each hourly point per week. Select All to show condensed Baseline High and Baseline Low for hourly, daily, and weekly baseline values. |
| Thresholds | If thresholds have been set for the data type that you are viewing, check boxes are displayed. These indicators show you the event settings relative to the performance of the data you are viewing. If thresholds have been set for the data type that you are viewing, check boxes are displayed. These indicators show you the event settings relative to the performance of the data you are viewing. PATROL Agent: Obtains and displays the PATROL Agent Threshold data. Limitations
|
| Events | Show Intelligent Events: Displays any intelligent events on the selected attributes and for the selected duration. PATROL Agent events that are associated with monitors are also considered intelligent events. Show Abnormality: Displays any events on the selected attributes and for the selected duration. Show External Events: Displays any events raised by a change entry, SNMP trap, or external events. |
| Graph Data | Hourly Maximum: Highest values of data found for the specified graph period. Peak indicator can be selected only when viewing data that is older than 24 hours. Hourly Minimum: Lowest values of data found for the specified graph period. Low indicator can be selected only when viewing data that is older than 24 hours. Period Maximum: Displays highest attribute value on the Y-axis. Period Minimum: Displays lowest attribute value on the Y-axis. Period Average: Displays average attribute value of all points of Period Minimum and Period Maximum attribute values. |
PATROL Agent Data (applicable only to 11.3.02 version) | Obtain Data from PATROL Agent: Reads and displays the performance metrics data directly from PATROL Agent. Show Annotations: Displays any annotations on the selected attributes and for the selected duration. Note Annotations longer than hundred characters are truncated beyond the first hundred characters. |
Viewing text parameters
If text parameters are available for a monitor on the PATROL Agent, you can view the text parameter on the Monitor Details page in the TrueSight console. Ensure that the following components are upgraded to version 11.0 or later:
- TrueSight Presentation Server
- TrueSight Infrastructure Management
- Integration Service
To view text parameters:
- On the Monitor Details page in the Performance Overview tab, click
 next to Multimetric Comparison and click Edit Settings.
 - Click the Single Metric Analysis button.
In the Metric field, select a text parameter. The text parameters are identified with the prefix "Text:". For example:
Text: System ConfigurationNote
When you select a text parameter in the Metric field, you can see only the Obtain Data and Show Thresholds options. The Obtain Data option remains selected by default and cannot be changed.
- Click Apply to view the text parameter.
Comments
Log in or register to comment.