Viewing and understanding noise reduction metrics
Supported with version 11.3.02 and later
The ability of viewing noise reduction metrics is available only with Infrastructure Management and Presentation Server 11.3.02 and later.
To be able to view and use this feature, you need to upgrade both Presentation Server and Infrastructure Management to version 11.3.02.
Noise reduction capability reduces event volumes generated by Infrastructure Management servers based on the set of rules defined at the cell level.
This feature provides the following benefits:
- Focus on important and relevant events: It reduces the need to analyze an endless number of incoming events and focus only on those events that are important and relevant to you.
- Resolve issues faster: It avoids the need for creating and managing a variety of rules, filters, and thresholds and thus, helps you resolve issues faster.
Noise reduction does not need any historical training and it works on both historical data and streaming data. It works on events generated by local cells on TrueSight Infrastructure Management servers and remote cells.
Noise reduction metrics help you visualize the total number of events that were suppressed based on predefined rules. The list of events displayed on the Events page represent the events stored in the database after noise reduction.
Accessing the Noise Reduction Metrics page
To access noise reduction metrics, navigate to the Monitoring > Events. At the top-right of the page, noise reduction metrics is depicted as a percentage.
Out-of-the-box event admins and super admins can view and click the percentage displayed under Noise Reduction at the top-right of the page to see further details. To enable other users to view noise reduction metrics, administrators can provide the Show Noise Reduction Metrics permission on the Roles tab.
Noise reduction availability
Noise reduction metrics will not be available if all the Infrastructure Management servers are disconnected in your environment. However, if some of the servers are connected, while others are disconnected, then noise reduction metrics is displayed for the connected servers only.
Note that to be able to view noise reduction metrics, you need to ensure that both the Presentation Server and Infrastructure Management servers are upgraded to 11.3.02. If some of the Infrastructure Management servers are upgraded to 11.3.02 while others are not, then noise reduction metrics is displayed for only those servers that are upgraded to 11.3.02.
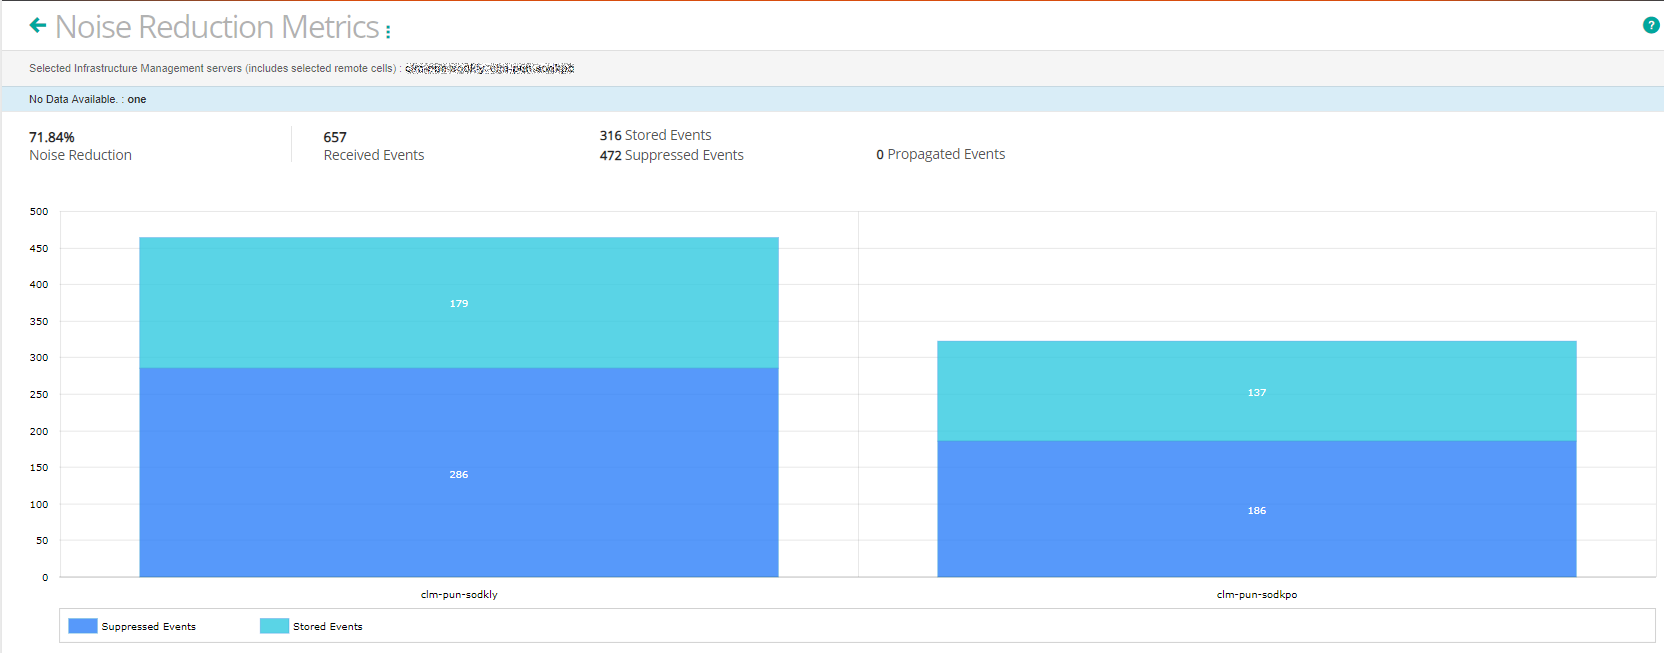
Understanding noise reduction metrics
On the Noise Reduction Metrics page, by default, you see an aggregate view of noise reduction. The aggregate view represents metrics for all the available Infrastructure Management servers (including all the associated remote cells) that are integrated with the TrueSight Presentation Server.
Note that noise reduction metrics displayed is directly dependent on the event sources selected. Thus, if you change the event source selection on the Events page, then the noise reduction metrics will reflect that selection.
You can change the event source selection from the Noise Reduction Metrics page also. You can choose to show metrics data for selected Infrastructure Management servers, selected remote cells, or a combination of selected Infrastructure Management servers and remote cells. For more information, see Viewing noise reduction metrics for particular event sources.
By default, the noise reduction metrics data is refreshed every two minutes. On the Events page, if you turn off
events auto-refresh
 , noise reduction metrics do not get refreshed automatically.
Noise reduction percentage calculation
The Noise Reduction Metrics page displays the noise reduction percentage, which is calculated as:
| Calculation | Applicable when you select... |
|---|---|
| Noise reduction % = Total suppressed events / [Total received events - Total propagated events from remote cells associated with the selected Infrastructure Management servers] x 100 | Infrastructure Management servers only |
| Noise reduction % = Total suppressed events / Total received events x 100 | Remote cells only |
Noise reduction metric descriptions
The Noise Reduction Metrics page displays the total count of each of the metrics used to calculated the noise reduction percentage.
The following table describes the various metrics:
| Metric | Description |
|---|---|
| Received events | Represents the total number of incoming events generated from the very beginning, or in other words, from the time Infrastructure Management servers began monitoring data. |
| Suppressed events | Represents the total number of events suppressed from the received events based on rules defined in the cell. Suppressed events = Received events - Events suppressed based on predefined rules |
| Stored events | Represents the total number of incoming events stored in the database (after noise reduction). These events also include a small number of internal events. Stored events = Received events - Suppressed events + Internal events |
| Propagated events | Represents events forwarded from remote cells to the destination Infrastructure Management servers based on
propagate rules
|
The following scenarios are excluded while calculating noise reduction metrics:
- Rate events coming from user-configured custom cells.
- Events propagated by remote cells that are not registered with Infrastructure Management servers.
Note
To be able to see noise reduction metrics correctly, it is necessary that remote cells propagate events to a single Infrastructure Management server.
Viewing noise reduction metrics for particular event sources
You can view noise reduction metrics for all the Infrastructure Management servers (including all the associated remote cells), selected Infrastructure Management servers, selected remote cells, or a combination of selected Infrastructure Management servers and remote cells. This capability can also help you compare noise reduction metrics between the selected Infrastructure Management servers or remote cells.
To select event sources:
- From the Noise Reduction Metrics main action menu, select, Select Event Source.
Select the desired Infrastructure Management servers and remote cells. Otherwise, to view noise reduction for all the Infrastructure Management servers, select All Infrastructure Management servers.
Click Select.
Note
If you select particular remote cells to view noise reduction metrics and if some of those cells are disconnected or not running, then data will be displayed only for the connected remote cells.
Best practice
Even though there is no specific limit on the number of event sources that you can select to represent on the graph, as a best practice do not select more than 25 event sources for a better viewing experience.
Setting the Noise Reduction Metrics page as the landing page
From the Noise Reduction Metrics main action menu, select Set as Landing Page.
Disabling noise reduction metrics
If you do not want noise reduction metrics to be displayed on the Events page, perform the following steps:
- On the Presentation Server, go to the command line.
- Run the following command:
tssh properties set cell.metrics.cache.scheduler.repeat.delay 0 reload
Resetting noise reduction metrics
Noise reduction metrics are calculated and displayed based on particular rules defined at the cell level. Suppose while noise reduction is still on, you change the rules to get better noise reduction. In this scenario, you might want the metrics to be calculated freshly. In this case, you can reset the noise reduction metrics as described in the following steps.
- On each of the Infrastructure Management servers in your environment, go to the command line.
- Run the following command for each cell (local and remote) associated with the Infrastructure Management server.
mcontrol -n <cellName> metrics reset
For more information, see Running the mcontrol command.
Comments
on the section following the line I am pasting in I get ?Unknown Attachment on my screen. By default, the noise reduction metrics data is refreshed every two minutes. On the Events page, if you turn off events auto-refresh , noise reduction metrics do not get refreshed automatically
Hi Scott! Thank for letting is know. Looking into this.
This is fixed, thanks.
Log in or register to comment.