SecOps Dashboard - Vulnerability Manager
The SecOps Dashboard provides summary information about the servers and vulnerabilities detected in a vulnerability scan. (You perform a vulnerability scan on a vulnerability management system and then import the results of the scan into BladeLogic Portal.) The dashboard provides tools for filtering the vulnerability information displayed. It also lists detailed information about individual vulnerabilities, including the servers in BMC Server Automation that exhibit the vulnerability and the BladeLogic content that can be deployed to resolve each vulnerability.
See the following sections for more information about the Dashboard::
Notes
- To populate the dashboard with information, select one or more scans from the Scan filter.
- The portal must be connected to the same BMC BladeLogic Server Automation Application Server that was used for mapping—that is, the same Application Server used when you associated scanned assets to servers and vulnerabilities to BladeLogic remediation content. If you connect the portal to a different Application Server, mapping errors can occur when the portal attempts to use missing or incorrect mapping information.
Understanding the dashboard

Viewing the total assets and vulnerabilities
At top left, you can see the total number of assets (servers) included in the selected scan or group. (Use filtering tools to select different scans or groups.) A total is provided for both mapped and unmapped assets and mapped and unmapped vulnerabilities.
Filtering vulnerabilities
Using filters, you can limit the amount of information the dashboard shows. Select options for any of the following filters to limit information::
- Scan—Show information from a scan of an enterprise that was performed with a vulnerability management system and imported into portal. You must select at least one scan to show any information in the dashboard. This is the only filter that affects the total assets and vulnerabilities, shown at left.
- Reference ID—Show information about selected Common Vulnerabilities and Exposures identifiers (CVEs) associated with vulnerabilities.
- Operating system—Show information about selected operating systems.
- Severity—Show information about vulnerabilities with a specify severity.
By default, vulnerabilities of severity 1 and 2 are excluded during import. You can change that behavior using the Scan File Import page. - Server group—Show information about vulnerabililties detected for a selected BladeLogic server group. Because you can select smart groups, this filtering option can be very useful for limiting the information displayed on the Dashboard.
Applying filtering choices
After making your filtering choices, click Apply Filters to activate your selections.
Viewing vulnerabilities by severity
The Vulnerabilities by Severity section depicts the vulnerabilities for each severity level with colored circles. Severity 5 is highest; severity 1 is lowest. The totals include both mapped and unmapped vulnerabilities. The gray portion of each circle represents unmapped vulnerabilities.
Hovering your cursor over a circle shows the total vulnerabilities with that severity level and the total number of mapped and unmapped servers where that vulnerability was detected.
The Vulnerabilities by Severity section reflects any choices you have made for the Scan, Vulnerability ID, OS, Severity, and Server Group filters.
Viewing the ten most common vulnerabilities
The Top 10 Vulnerabilities section shows the ten most common vulnerabilities, depending on your filtering choices. The list includes the total number of instances of each vulnerability.
Viewing detailed information about vulnerabilities
The Mapped Asset Details section lists all mapped assets with mapped vulnerabilities based on your current filtering selections. The assets listed in this section are the assets you can choose to remediate when you launch the Remediation operation wizard. After you launch the wizard, you can remove assets from this list that do not require remediation.
Use the filters at the top of each column in the Mapped Asset Details section to limit the assets displayed. The filters are described below:
- BSA Target—Servers managed with BladeLogic that have been mapped to an asset included in the vulnerability scan.
- Vulnerability Name—Name of the vulnerability identified in the vulnerability scan that has been mapped to remediation content in BladeLogic.
- Reference ID—Common Vulnerabilities and Exposure (CVE) ID associated with this vulnerability, as determined during the vulnerability scan.
- Remediation Type—Type of remediation content in BladeLogic used to correct this problem, such as a patch or BLPackage.
- Remediation Name—Name of the BladeLogic remediation content mapped to this vulnerability.
Using the filters at the top of each column hides items from the Mapped Asset Details list but those items are not removed from the list. The only way to remove items from the list is by using the vulnerability filters at top right. Later, when you launch the Remediation operation wizard, you can remove vulnerabilities from the list that you do not want to remediate.
Launching the Remediation operation wizard
Click Remediate to open the Remediation operation wizard, which allows you to select the assets to be modified, schedule remediation operations, and specify any notifications that are generated by the operation.
The Remediate button is only enabled when a set of conditions are satisfied, as illustrated in the following flowchart.
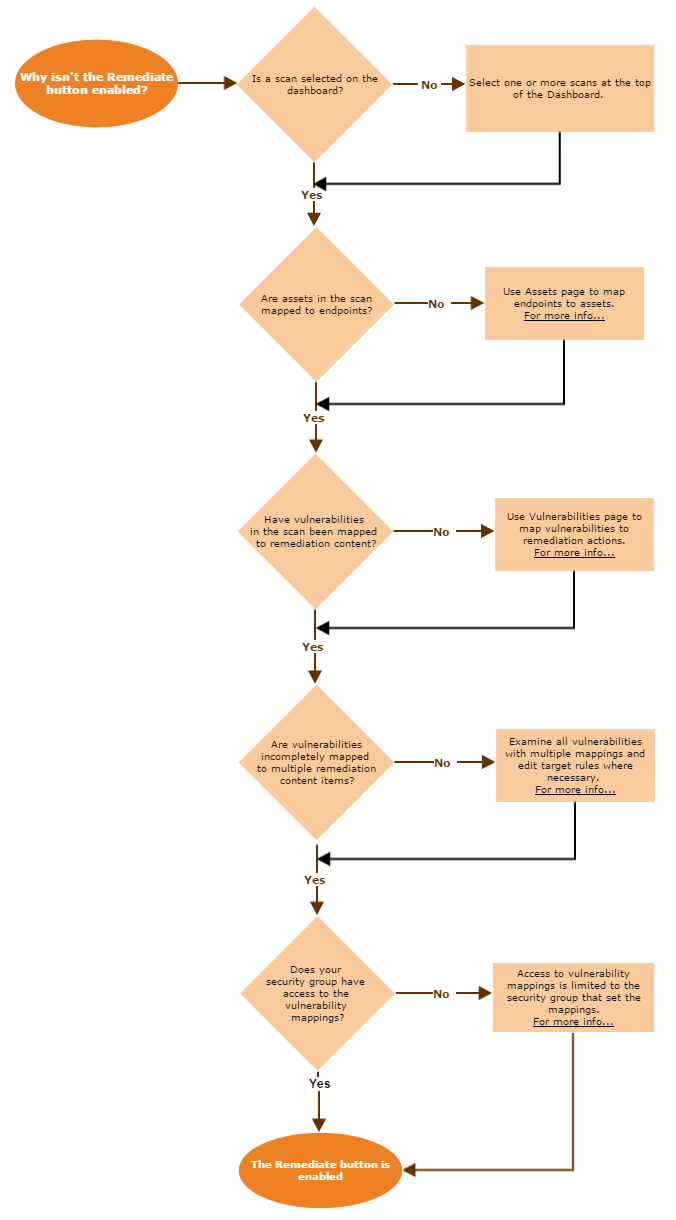
If you answer yes to all the questions in the flowchart and the Remediate button is still not enabled, contact BMC Support.
Comments
Log in or register to comment.